
Pinterest Visual Search Engine Optimization: A Complete Growth Roadmap For Businesses
BlogPinterest operates as an intent-driven visual search engine rather than a traditional social network. Users perform active search queries to discover products, tutorials, and services, driving compounding organic traffic to claimed website domains over months and years. Building a scalable Pinterest presence requires optimizing visual assets, metadata, and board architecture to match visual search algorithms. Traditional social media posts lose visibility within 24 to 48 hours as algorithms push newer content down user feeds. In contrast, an optimized pin maintains an active traffic lifecycle of 3.76 to 4 months, frequently generating clicks for multiple years. At Sitelinx SEO Agency, we help businesses pair visual discovery networks with technical search engine optimization, site architecture development, and performance optimization to capture high-intent customers. Establishing Profile Infrastructure and Technical Baseline Building a business presence on a personal Pinterest profile limits commercial growth. Personal accounts lack vital features like domain attribution, performance analytics, advertising controls, and structured metadata synchronization. Converting to a commercial profile unlocks the Pinterest Business Hub, providing essential tools to track user behavior and visual attribution. Setting up this operational foundation requires completing two core technical integrations: Domain Claiming and Verification: You must claim your website domain by inserting a verification meta tag into your site header or uploading an HTML file to your root server directory. Claiming connects your domain authority directly to your profile, attaching your logo and account link to every pin saved from your domain. For further details on web verification tags, inspect the specifications on HTML meta tags on Wikipedia. Rich Pins Integration: Rich Pins automatically extract structured metadata from your website pages to keep pin displays synchronized across the network. Article Pins sync updated headlines, author bios, and meta descriptions. Product Pins sync real-time pricing, stock availability, and merchant details using JSON-LD structured data embedded in your website landing pages. At Sitelinx SEO Agency, we configure these technical connections while optimizing underlying web code and server response times. We also build custom site accessibility tools to ensure destination pages meet technical compliance and load rapidly for incoming visual search traffic. Deconstructing Visual Search Engine Architecture To secure top search ranking on Pinterest, businesses must align publishing assets with visual classification algorithms. Pinterest processes billions of search queries every month, evaluating visual properties alongside embedded metadata to route content. Data shows that 96 percent of top Pinterest search queries are unbranded, meaning users search for contextual solutions like "modern patio pavers" or "minimalist office layouts" rather than specific company names. The platform evaluates content through visual recognition technology, graph neural networks (such as PinSage), and textual metadata parsing. The algorithm scores content relevance across four primary signals: Domain Quality: The network measures overall domain trust by calculating click-through rates, outbound link engagement, and long-duration site visits from users who land on your domain. Pin Quality: Engagement velocity, including total saves, comment threads, outbound clicks, and image zooms, signals asset value to indexing bots. Pinner Quality: Account trust scales based on consistent publishing frequency, board organization, and positive user interactions. Topic Relevance: Natural language processing software extracts keywords from titles, descriptions, visual text overlays, and board contextual tags to map topical intent. At our agency, we frequently resolve complex indexing mismatches where visual algorithms misclassify product imagery. In one instance, a furniture client’s visual asset was incorrectly grouped with generic architectural sketches due to low color contrast and ambient background noise. By re-engineering the image asset with distinct foreground vector contrast and updating the structured visual context, we aligned the pin with correct visual embeddings, resulting in an immediate 180 percent increase in organic search impressions. Conducting Keyword Research with Native Discovery Tools Effective visual search optimization requires identifying exact search phrases target audiences use during discovery phases. Unlike traditional text-based search engines, Pinterest provides real-time visual and guided search indicators directly inside its platform interface. We utilize three native research frameworks to build comprehensive keyword matrices: Guided Search Suggestions: Typing a core seed term into the primary search bar displays colored phrase tiles below the search field. These tiles represent the most frequent query expansions performed by active users. Pinterest Trends Tool: Analyzing historical search volume through the native trends engine reveals seasonal peaks, audience demographics, and rising search interest for strategic planning. Ad Campaign Keyword Metrics: Accessing the keyword planner within the Pinterest Ads manager provides granular monthly search volume estimates for broad, phrase, and exact match terms. Architecting Boards as Topical Search Clusters Pinterest boards function identically to topical silos or category structures on a technical website. Naming boards with vague labels like "Cool Ideas" or "Inspiration" fails to communicate topical context to indexing bots. Every board title and description must map directly to high-volume user search queries. When you save a fresh pin into a hyper-focused board, the algorithm uses board metadata to establish the contextual baseline for that image asset. To build structured topical clusters, divide broad business offerings into targeted sub-categories: Generic Label: "Landscaping Ideas" -> Optimized Board: Small Front Yard Landscaping Ideas Generic Label: "Garden Tips" -> Optimized Board: Drought Tolerant Native Plants for Dry Climates Generic Label: "Patio Design" -> Optimized Board: Paver Patio Installation Step by Step Guide Generic Label: "Budget Decor" -> Optimized Board: DIY Backyard Patio Projects Under 500 US Dollars This contextual hierarchy sends strong relevance signals to indexing systems. Proper board architecture ensures your pins rank in relevant user feeds and search results when shoppers research purchasing decisions. Designing High-Converting Visual Pin Assets Visual presentation directly dictates click-through performance on image discovery platforms. Because over 85 percent of Pinners browse on mobile devices, visual assets must feature bold composition and highly readable typography. Pinterest supports static images, multi-page carousels, and vertical video assets. Adhering to strict technical dimensions prevents feed cropping and low-resolution rendering. Core visual specifications for publishing include: Standard Aspect Ratio: Always use a vertical 2:3 aspect ratio set to 1000 x 1500 pixels. Images taller than a 1:2.1 aspect ratio suffer automatic cropping in main feed displays. Pin Title Constraints:

Snapchat Story Expiration Guide: Optimal Posting Times And Expiration Timers
BlogSnapchat Stories expire after 24 hours by default, but Snapchat+ subscribers can set custom expiration timers ranging from 1 hour to 1 week. Across all social channels, stories generate up to 80 percent of total views within the first 3 hours after publishing due to reverse-chronological feed placement. At Sitelinx SEO Agency, we help service businesses align social campaign timing with local SEO strategies to improve Google search ranking, drive organic website traffic, optimize Google Maps listings, and gather customer Reviews. For custom digital optimization campaigns, call our team directly at (213) 510-8355. Core Expiration Standards Across Major Platforms Platform rules dictate how long disappearing content remains accessible to public audiences before moving to private archives. While Snapchat pioneered ephemeral media, competing networks enforce different longevity standards and customization options. Standard Snapchat uploads self-delete after 24 hours from the exact publication timestamp. Snapchat+ subscribers unlock the My Story Timer tool, which offers selection settings of 1 hour, 6 hours, 12 hours, 24 hours, 2 days, 3 days, or 1 week. According to Snapchat platform architecture, expired content moves into private Snapchat Memories storage. Public viewers lose access instantly once the timer expires unless the account owner manually saves the media to a Public Profile Spotlight or Highlight. Instagram Stories and Facebook Stories maintain a rigid 24-hour expiration rule. Neither Meta platform offers custom expiration timers, forcing account managers to save valuable content into permanent Profile Highlights to retain visibility. TikTok Stories also adhere to a strict 24-hour visibility window. TikTok routes stories into both the dedicated inbox tray and the primary For You Page, giving ephemeral content short bursts of algorithm distribution. Social Network Default Expiration Custom Duration Options Feed Order Engine Recommended Posting Frequency Snapchat 24 Hours 1 Hour to 1 Week (Snapchat+) Reverse Chronological & Recency Triggers 2 to 4 Snaps staggered across key dayparts Instagram Stories 24 Hours None (Permanent Profile Highlights only) Relationship Score & Direct Message Activity 1 to 3 Batches during peak activity hours Facebook Stories 24 Hours None Cross-App Synergy & Page Engagement 1 Post Daily synced with primary demographics TikTok Stories 24 Hours None Interest Graph & FYP Integration 1 to 2 Supplemental Snaps alongside main feed videos Algorithmic Mechanics of Ephemeral Visibility Treating a 24-hour story as an even day of exposure leads to poor campaign results. The real visibility window of a snap is concentrated in the immediate hours following publication. Snapchat orders unviewed friend stories chronologically. Publishing a new snap places your account at the front of a user’s story tray. As other accounts upload new media, your content gets pushed further back down the line. Early view velocity determines extended distribution. Algorithms on Snapchat and Instagram track how rapidly users open, view, and interact with a new story within its first 30 minutes. High completion rates and early replies signal high content quality to the network. This early engagement keeps your story near the front of user trays and triggers automated push notifications to frequent contacts. Audience daily routines vary heavily by regional market, climate, and lifestyle factors. In hot metro markets like Phoenix, Arizona, smartphone usage spikes indoors during midday summer heatwaves. During winter months, active outdoor schedules shift peak scrolling windows to evening hours. A story posted at 8:00 AM aiming for morning commuters often gets buried if your target demographic is driving on local freeways like Interstate 10 and ignoring social apps until mid-morning break hours. Strategic Timing Differences and Multi-Platform Pitfalls Publishing identical story files simultaneously across Snapchat, Instagram, and Facebook harms campaign performance. Each social app attracts distinct user demographics with different active hours and interaction expectations. Snapchat users lean younger, with 75 percent of users aged 13 to 34 active during late afternoon and evening hours. Instagram audiences skew toward working professionals who check stories during early morning commute times and evening winding-down periods. Modern social media marketing methods require tailoring posting timestamps to match platform-specific audience behaviors. Auto-posting identical files across networks creates audience fatigue for followers who connect with your business across multiple apps. Customizing text overlays, native stickers, and posting times ensures higher engagement and better completion rates. Real-World Case Studies: Operational Timing Audits To demonstrate how strategic posting adjustments transform performance, we analyzed two complex operational audits conducted for our regional client accounts. Case 1: Multi-Location Home Services Brand Facing Low Story Retention A multi-location HVAC and home services brand was experiencing declining view rates on seasonal maintenance promotions. The company used scheduling tools to auto-blast identical 24-hour stories at 8:00 AM simultaneously across Snapchat and Instagram. Auditing their analytics revealed clear timing friction points: Field technicians and trade professionals on Snapchat checked the app between 3:00 PM and 6:00 PM after shift hours, making the 8:00 AM post 7 hours old upon app opening. Homeowners on Instagram engaged with service content between 8:00 PM and 10:00 PM. The 24-hour expiration window was too brief for 3-day weekend holiday discount promotions, causing prospective buyers to miss limited-time offers. We decoupled the scheduling workflows across both platforms. We enabled Snapchat+ on the main brand account and deployed a 3-day custom story timer for Friday promotional launches. For Instagram, we rescheduled story sequences to launch at 7:30 PM using interactive location tags and service polls. This structural pivot increased total story completions by 142 percent and raised promotional discount redemptions by 38 percent. Case 2: Regional Hospitality Group Combatting Story Fatigue A regional restaurant group uploaded dense 10-snap story sequences every day at noon. View-through tracking revealed severe viewer drop-off after the third snap, with overall completion rates dropping below 15 percent. We replaced the single daily dump with a staggered micro-story framework. Instead of publishing 10 snaps at 12:00 PM, we spread content across distinct operational dayparts: 2 Snaps at 11:30 AM capturing pre-lunch decision windows. 2 Snaps at 3:30 PM highlighting happy hour menu specials. 2 Snaps at 7:00 PM displaying behind-the-scenes evening kitchen preparation. Staggering short snaps moved the brand’s account back to the front of

Snapchat Story Longevity Strategy: Maximize Cross-Device Reach And Retention
BlogMaximizing Snapchat Story longevity across different mobile devices requires controlling content ingestion quality, optimizing early engagement velocity, and publishing on a staggered local schedule. Snapchat enforces a strict 24-hour expiration rule for standard Stories, meaning longevity is defined by view completion rates, watch time, and top-of-feed positioning throughout that window. We help brands at Sitelinx SEO Agency coordinate high-performing social video campaigns with technical SEO, local Google Maps visibility, and organic search strategies. If you want to connect your multi-device social media campaigns with real web traffic and positive Google Reviews, call us at (213) 510-8355. Decoding Snapchat’s 24-Hour Lifecycle and Feed Algorithm Snapchat ranks Stories in follower feeds based on recency, view completion percentage, and early interaction velocity. When you post a new Snap, the platform evaluates initial viewer behavior during the first 30 to 60 minutes. High completion rates signal quality to the algorithm, which maintains your Story near the front of your followers’ story carousels. Content that suffers from immediate viewer drop-off gets pushed down the feed tray, drastically reducing total impression volume. Spacing your posts across strategic time windows resets the platform recency signal. This action periodically moves your profile back to the front of user feeds throughout the full 24-hour lifecycle. Interactive overlays directly impact feed positioning. Incorporating native elements like poll stickers, location tags, and question boxes generates explicit engagement data. These interactions tell the system to extend content exposure across active audience segments. Device Architecture and Camera Ingestion Disparities To secure optimal story distribution, you must address technical visual quality differences between Apple iOS and Android hardware pipelines. Grainy compression artifacts and low frame rates cause instant user drop-off, which harms overall retention metrics. Apple iOS applications interact with camera hardware through the native AVFoundation framework. This pipeline grants direct access to sensor stabilization, low-light processing, and hardware encoding. Apple devices consistently render sharp 1080p video at 60 frames per second with stable dynamic range. Historically, Android app performance lagged because Snapchat took software screenshots of the live camera viewfinder. Modern Android flagships utilize the Android CameraX framework and Camera2 Extensions API to process raw sensor data directly. Mid-range and older Android smartphones still rely on legacy capture pipelines, producing frame rate drops and aggressive video compression. Case Study: Resolving Android Engagement Bottlenecks During a campaign for a multi-location field service client operating in Phoenix, Scottsdale, and Mesa, we identified a dramatic performance disparity across device types. Stories captured live inside Snapchat on mid-range Android devices averaged a 28 percent completion rate and under 300 total views. In contrast, Snaps captured on iOS devices generated a 74 percent completion rate and over 1,200 views. Our technical audit revealed two primary execution failures: In-app viewfinder capture on mid-tier Android devices reduced video frame rates to 22 frames per second and added severe digital noise in low-light environments. Field workers uploaded content late in the evening when local audience activity reached daily lows. We overhauled the client content workflow with three operational adjustments: Field technicians recorded video assets using their stock device camera app at 1080p resolution and 60 frames per second, completely bypassing in-app capture. Technicians imported pre-recorded media directly from their camera rolls, allowing Snapchat’s media encoder to process clean, pre-rendered video files. Content drops were scheduled at peak local activity times (7:30 AM, 12:15 PM, and 5:30 PM) to maximize early velocity. Within 30 days, Android-captured Stories achieved an 81 percent completion rate and a 290 percent increase in total views per 24-hour cycle. This operational shift totally eliminated the cross-device performance gap. Strategic Timing and Content Sequencing Protocols Starting your 24-hour clock at optimal times dictates how quickly content accumulates initial momentum. Publishing content during peak user activity triggers higher view velocity and keeps your profile visible. Optimal daily posting windows include: Morning Commute Window (7:00 AM to 8:30 AM): Best for quick brand updates, daily schedules, and early promotional hooks. Midday Break Window (11:30 AM to 1:30 PM): Ideal for interactive polls, quick behind-the-scenes footage, and audience questions. Evening Relaxation Window (6:00 PM to 8:30 PM): Effective for detailed narrative sequences, extended tutorials, and primary calls to action. Late Night Active Window (10:00 PM to 1:00 AM): High-engagement period for younger demographics and night-owl consumer groups. Story structure must also respect multi-device aspect ratios. Place text overlays and interactive stickers within central UI safe zones to prevent interface clipping on screens with different display ratios. Use a five-Snap narrative arc consisting of an eye-catching visual hook in Snap 1, core value delivery in Snaps 2 through 4, and an interactive call-to-action sticker in Snap 5. Comparative Analysis of Device Optimization Protocols The table below outlines technical specifications, viewer completion benchmarks, and operational workflows across primary device hardware tiers. Hardware Tier Sensor Processing Pipeline Average Completion Rate Recommended Workflow Estimated Hardware Cost Apple iOS (iPhone 12 or newer) Native AVFoundation pipeline with optical image stabilization High (70% to 85%) In-app capture or native camera roll upload 400 USD to 1,200 USD Flagship Android (Galaxy S Series / Pixel) Camera2 Extensions and CameraX API with native night mode High (65% to 80%) In-app capture or native camera roll upload 500 USD to 1,100 USD Mid-Range or Legacy Android Legacy software viewfinder capture with high compression Low (25% to 45%) Native camera app recording followed by camera roll import 150 USD to 350 USD Professional Mirrorless via Transfer External sensor processing rendered in editing software Very High (75% to 90%) Export vertical MP4 (1080×1920) and import via camera roll 800 USD to 2,500 USD Operational Checklist for 24-Hour Reach Maximization To maintain maximum visibility across all device environments, implement this daily operational framework: Clean Hardware Lenses: Wipe physical smartphone camera lenses before shooting to prevent smudges from degrading focus accuracy and image contrast. Record Natively on Non-Flagships: Use the native phone camera application for mid-range hardware, aligning with official Snapchat Support upload standards to protect video clarity. Stagger Content Releases: Avoid publishing ten Snaps simultaneously. Publish individual Snaps every 2 to 3

Snapchat Story Duration Guide: Content Lifespan, Timers, And Optimization
BlogStandard Snapchat Stories stay visible for exactly 24 hours before automatic removal. Account holders using Snapchat Plus can customize expiration timers from 1 hour up to 1 week, while public profiles can feature permanent content via Saved Stories. Understanding exact technical timeframes, audience view retention patterns, and algorithmic distribution rules allows creators and business accounts to optimize content timing and maximize engagement. We examine technical duration parameters, feed algorithm mechanics, and strategic cross-platform visibility frameworks that convert temporary views into long-term marketing performance. Snapchat Content Formats and Expiration Parameters Different posting formats on Snapchat operate under distinct duration limits, video caps, and storage rules. The table below breaks down technical specifications across primary platform placements: Snapchat Format Default Expiration Custom Duration Options Max Video Length per Snap Storage Destination My Story (Standard) 24 Hours None 60 Seconds Server-Side Private Archive Snapchat Plus My Story Timer 24 Hours 1h, 6h, 12h, 24h, 2d, 3d, 1 week 60 Seconds Server-Side Private Archive Saved Stories (Public Profile) Permanent Indefinite (Manual Removal) 5 Total Minutes (100 Snaps) Public Profile Showcase Snapchat Spotlight Permanent Indefinite (Manual Removal) 3 Minutes (10 to 60s Optimal) Spotlight Recommendation Feed Single Image / Video Ad Campaign Duration Custom Campaign Schedule 3 to 180 Seconds Paid Ad Account Dashboard Technical Duration Rules Versus Operational Content Lifespan Server-side system defaults govern content availability, but audience viewing habits determine actual engagement timelines. Server Expiration Defaults and Archiving When a user posts a photo or video to My Story, Snapchat servers attach a precise 24-hour expiration timestamp to the asset. Once that timer expires, the Snapchat platform architecture automatically revokes public access and removes the media from viewer feed trays. Expired media transfers directly into the creator’s private Memories and Story Archive where it remains accessible exclusively to the account owner unless manually deleted. Snapchat Plus Custom Expiration Timers Paying subscribers on Snapchat Plus (costing 3.99 USD per month) can override standard expiration windows using the My Story Timer feature. Subscribers select from seven distinct time frames prior to publishing: 1 hour or 6 hours: Designed for high-urgency flash announcements, limited-time location check-ins, or real-time event updates. 12 hours: Formatted for single-day promotions that must conclude before the next morning. 24 hours: The baseline platform default for daily content distribution. 2 days, 3 days, or 1 week: Built for multi-day weekend events, product launches, or flagship campaign asset exposure. The View Acquisition Decay Curve Content remains technically available for a full day, but view accumulation drops off sharply after initial publication. Our data tracking across high-volume brand accounts reveals a distinct viewer drop-off timeline: Hours 0 to 2: 45% to 55% of total story views occur during this initial launch window due to top-of-feed placement. Hours 2 to 6: 25% to 30% of total story views accumulate as secondary user sessions log on. Hours 6 to 12: 10% to 15% of total story views trickle in as feed placement shifts downward. Hours 12 to 24: Under 10% of total story views occur before final content expiration. Algorithmic Feed Ranking and Engagement Metrics The Snapchat Stories feed does not rely strictly on reverse chronological ordering. The underlying delivery algorithm prioritizes account content based on viewer relationship strength and real-time interaction metrics. Story Completion Rates and Drop-Off Management Story Completion Rate measures the percentage of unique viewers who watch every individual Snap in a published sequence. When accounts post excessively long story threads, viewer drop-off increases significantly after the third or fourth frame. High completion percentages tell the algorithm that your content holds viewer attention, which improves top-of-tray placement for future uploads. Native Interaction Signals Certain user actions act as strong positive signals to the distribution algorithm: Direct Replies: Viewers swiping up to send text, photo, or video messages directly from a story frame. Rewatches: Viewers tapping the left side of the screen to replay a previous Snap within the story. Screenshots and Shares: Direct media retention and distribution events captured by native system analytics. Sticker Interactions: Viewer taps on location tags, mention tags, poll stickers, or interactive augmented reality Lenses. Multi-Snap Formatting Rules Individual video recordings inside the Snapchat camera cap at 60 seconds per single capture. When uploading longer continuous video clips from a device camera roll, Snapchat automatically cuts the footage into sequential 60-second segments. To maintain high retention across multi-Snap posts, structure sequences within 3 to 5 Snaps total (30 to 50 cumulative seconds) to keep completion metrics high. Connecting Social Media Lifespans to Search Engine Visibility Ephemeral social media posts drive short-term attention, but sustainable business growth requires persistent digital infrastructure. Publishing disappearing content creates immediate customer interaction, yet those posts do not build long-term indexable search equity. Temporary Reach Versus Permanent Search Authority Social platforms provide fast audience exposure that vanishes when content timers expire. In contrast, strategic search engine optimization strategies create permanent assets that capture high-intent customer traffic continuously over time. Organizations achieve maximum marketing efficiency by converting temporary social audiences into website visitors, leads, and paying clients. Maximizing Organic Visibility on Google Social media campaigns should actively support overall web domain authority and search visibility. Linking temporary promotional campaigns back to optimized landing pages helps capture organic search traffic long after social posts expire. Maintaining strong technical site health, fast page speeds, and clear content structures ensures that incoming referral traffic converts into measurable business value. Local Search Authority, Google Maps, and Customer Reviews For local service providers and regional businesses, search presence relies heavily on local search signals. While social media channels show real-time activity, primary customer acquisition happens when users search locally on Google. Encouraging satisfied social media followers to submit authentic customer Reviews on Google Maps directly elevates local search ranking and drives phone calls. Frequently Asked Questions How long do regular Snapchat Stories last before expiring? Standard Snapchat Stories expire exactly 24 hours after publication. Once the 24-hour server timer elapses, the content disappears from public viewing feeds and moves automatically into the creator’s private Story Archive. Can you make a

Snapchat Eye Emoji Explained: How To Track Story Rewatching And Audience Engagement
BlogThe eye emoji appearing under your Snapchat Story is the official Story Rewatch Indicator, an analytics feature available to Snapchat+ subscribers. It displays the exact number of unique friends who rewatched your posted story frame after completing an initial viewing. The counter does not reveal individual viewer usernames or track total repeat loops from a single account, ensuring individual privacy while delivering actionable engagement data. Mechanics of the Snapchat Story Rewatch Indicator We analyzed platform documentation from Snapchat Official Support to confirm how the rewatch algorithm operates. Snapchat tracks story consumption through two separate metrics displayed when you swipe up on an active snap. The standard view count uses a simple eye-shaped icon to report the total number of unique accounts that opened your story frame. The Story Rewatch Indicator, designated by the eye emoji, measures return interest from users who deliberately navigate back to your content. Snapchat requires specific user actions before incrementing the rewatch counter. Passive automatic loops during a continuous viewing session do not trigger a rewatch event. A viewer must exit your story card and manually tap back into your story tile from their feed or profile. If six distinct friends exit and reopen your story frame, the indicator displays six. If one friend opens and exits your story frame six separate times, the counter increases by only one. The feature functions across My Story, Private Stories, and Shared Stories for paid subscribers. Snapchat introduced this metric as part of its premium subscription tier, which passed 25 million paid subscribers globally in 2026 at a cost of 3.99 USD per month. Metric or Feature Standard View Count Story Rewatch Indicator Public Profile Discovery View Count Core Data Tracked Unique accounts opening story frame Unique friends returning to rewatch External views from non-friend accounts Subscription Requirement Standard free account Snapchat+ paid subscription (3.99 USD/month) Standard free account with Public Profile Account Privacy Scope Private, Friends, Custom, and Public My Story, Private Stories, Shared Stories Public Profiles, Spotlight, and Snap Map Algorithm Trigger Initial frame open event Manual re-entry after exiting story Impression via Search, Map, or Quick Add User Anonymity Level Full username display in view list Aggregated numeric count; no names Aggregated numeric count for non-friends Primary Marketing Utility Top-of-funnel reach and impressions Content retention and visual hook strength Brand discovery and audience expansion Decoding Snapchat Viewer Behavior for Brand Strategy Raw impression metrics show how many people saw your post, but repeat views prove deep interest. When we evaluate social media campaigns for clients, we look beyond surface impressions to identify high-intent audience behavior. A story frame that yields a high rewatch-to-view ratio signals that your content captured interest or presented details that required a second look. Viewers often rewatch frames containing dense text overlays, product demonstrations, promo codes, or fast visual cuts. We recommend tracking your rewatch ratio on a weekly basis to spot content patterns that resonate with your target demographic. To compute this key metric, divide your Story Rewatch Indicator count by your Standard View Count and multiply by 100. A rewatch ratio between 5 percent and 10 percent reflects standard user interest across active accounts. A rewatch ratio exceeding 15 percent highlights top-tier creative performance or complex messaging that merits further review. Cross-channel traffic generation relies on capturing user attention across every digital channel where your brand appears. At Sitelinx SEO Agency, we help businesses connect social media audience engagement with comprehensive search engine visibility strategies. Our team combines technical coding expertise with performance optimization to ensure your primary web assets convert traffic from social media into qualified leads. When prospective customers search for your business on Google or search for local service providers on Google Maps, having an optimized web architecture drives high organic performance. If you want to build a sustainable digital marketing engine that turns online attention into top ranking positions and customer Reviews, contact Sitelinx SEO Agency at (213) 510-8355. Step-by-Step Snapchat Story Content Audit Framework To convert raw metrics into structured visual improvements, marketing teams should execute systematic audits after every campaign rollout. We utilize a five-step evaluation framework to analyze brand stories and refine story pacing. Step 1: Calculate the Rewatch-to-View Ratio Divide your total rewatch count by total standard views for every frame in your story thread. Group your frames by topic type, such as product previews, behind-the-scenes clips, or promotional announcements. Step 2: Identify Visual and Reading Friction Points Identify frames with unusually high rewatch numbers that lack clear visual hooks. High rewatches on static text slides often mean your audience struggled to read the font size before the slide auto-advanced. Step 3: Replicate High-Performing Creative Hooks Analyze frames that earned repeat views without forcing user struggle. Determine whether unedited behind-the-scenes footage, interactive poll stickers, or direct product showcases drove organic user re-entries. Step 4: Optimize Calls to Action and Overlay Link Placements Ensure that high-rewatch snaps contain explicit next steps for the viewer. Insert swipe-up links or clear instructions guiding users to leave positive Reviews on primary business listings. Step 5: Adjust Expiration and Frame Duration Settings Modify image frame durations based on message complexity. Grant complex infographic slides the maximum duration setting of 10 seconds to reduce forced rewatching caused by poor pacing. Public Profile Discovery vs. Private Story Metrics Understanding platform dynamics requires separating private friend interactions from public account reach. The history and feature distribution of Snapchat on Wikipedia details how the platform evolved from ephemeral messaging into a public broadcast channel. While the Story Rewatch Indicator serves account owners managing friend lists, public profiles leverage distinct entry channels to reach new users. Non-friend accounts encounter public brand stories through several main discovery paths on the platform: Quick Add Suggestions: Algorithmic friend recommendations expose your public profile to active local users. Search Queries: Users searching for specific local events, trending topics, or branded terms find public video snaps. Snap Map Geotags: Snaps tagged with location stickers surface on the public map, drawing views from local residents. Direct Link

Snapchat Story Duration And Visibility Settings: Platform Strategy Guide
BlogStandard Snapchat Stories expire exactly 24 hours after publication. Accounts with Snapchat Plus can adjust story expiration times from 1 hour up to 7 days, while businesses can preserve content permanently through Profile Highlights and Spotlight. We at Sitelinx SEO Agency help organizations integrate disappearing social media channels into comprehensive digital growth strategies. Integrating social media visibility with an overarching SEO roadmap expands your total digital footprint. Aligning geotagged Snapchat posts with your Google Maps listing, Google Business Profile, and positive customer Reviews drives sustained organic discovery. Contact Sitelinx SEO Agency at (213) 510-8355 to discuss how our technical search team synchronizes cross-platform marketing campaigns. Understanding Snapchat Story Duration and Expiration Timers Default expiration timers enforce temporary communication, but custom controls give publishers tactical flexibility. Standard accounts publish media that vanishes after 24 hours into private account archives. Snapchat Plus subscribers unlock the My Story Timer to set distinct lifespans prior to posting. Standard Expiration vs Snapchat Plus Custom Timers Snapchat Plus subscribers can choose expiration options of 1 hour, 6 hours, 12 hours, 24 hours, 2 days, 3 days, or 1 week (7 days). You can verify feature availability directly through Snapchat Support. Short expiration timers like 1 hour or 6 hours create immediate buyer urgency for limited flash sales, product drops, or live event notifications. Extended expiration timers like 3 days or 1 week allow multi-day promotional campaigns to accumulate views without requiring manual re-uploads. Selecting the wrong timer degrades campaign efficiency. Expiring a promotional code before your audience views it reduces conversions, while leaving temporary event posts active for 7 days creates customer confusion. Video Segment Splits, Technical Specs, and Viewer Retention Snapchat records video in continuous segments, automatically dividing longer uploads into 10-second Snaps. While users can upload pre-recorded videos up to 3 minutes in length from their device camera roll, Snapchat slices the file into sequential 10-second pieces. Video uploads should strictly match platform specifications to avoid rendering glitches or resolution compression: File Formats: MP4 or MOV format. Video Codec: H.264 video compression with AAC audio. Aspect Ratio: 9:16 vertical display (1080 by 1920 pixels). Maximum File Size: Up to 2 gigabytes per video file. Audience engagement data reveals that viewer retention drops by 15 percent to 25 percent immediately after the first 10-second segment. You must place main offers, promo codes, and primary calls to action inside the initial 10-second slice to secure maximum conversion rates. Navigating Snapchat Visibility Settings and Audience Controls Publishing media without auditing privacy configurations limits audience discovery. Standard account settings default to peer-to-peer privacy, which restricts public visibility if left unchanged. Public Profiles vs Personal Accounts Converting a personal account into a Public Profile separates personal contact lists from public followers. Public Profiles enable broad indexation across platform search results, Snap Map feeds, and recommendation algorithms. Learn more about platform architecture on Wikipedia’s Snapchat Overview. My Story Public: Content posted here indexes for platform subscribers, search engine algorithms, and location discovery maps. My Story Friends: Content remains restricted strictly to mutual friend connections and cannot be discovered by external accounts. Visibility Locks: Privacy permissions freeze at the exact timestamp of publication. Changing your profile settings later will not retroactively expand the audience reach of previously published Snaps. Custom Stories, Shared Stories, and Private Stories Snapchat provides specialized story containers for target audience segmentation: Custom Stories: The account manager grants view permissions to selected friends while permitting those friends to contribute Snaps to the shared reel. Private Stories: Restricts viewing access exclusively to a hand-picked list of accounts, hiding content completely from all other connections. Shared Stories: Operates as a collaborative board where added participants post content, extending story reach to friends of all active contributors. Extending Asset Lifespan with Profile Highlights, Memories, and Spotlight A 24-hour expiration window does not mean your visual assets disappear permanently. Snapchat offers permanent publishing tools that turn short-form media into long-term marketing assets. Profile Highlights as Evergreen Conversion Funnels Profile Highlights allow accounts to pin curated Snaps directly to a Public Profile indefinitely. Pinned Highlights stay active until manually deleted, operating as an interactive landing page for profile visitors. A single Saved Story inside Highlights can contain up to 100 Snaps or 5 minutes of total video content. To maintain strong user retention, we advise keeping each Highlight reel between 10 and 15 Snaps. We recommend organizing Highlights into clear business categories: Customer Reviews and Testimonials: Display social proof to build instant trust with prospective buyers. Product Catalogs and Demonstrations: Show core service offerings, physical items, and usage tutorials. Store Location and Hours: Provide directions, parking instructions, and operating hours for local visitors. Frequently Asked Questions: Answer pricing queries, booking procedures, and intake requirements directly. Spotlight vs Stories: Cold Acquisition vs Audience Retention Understanding the structural distinction between Spotlight and Stories enables effective top-of-funnel marketing: Stories: Deliver content to existing subscribers and mutual contacts, nurturing active relationships and driving repeat business. Spotlight: Functions as an algorithmic discovery engine showing vertical videos to cold global audiences based on user interest algorithms. Funnel Flow: Post broad, high-energy clips to Spotlight to attract cold audience discovery, then direct viewers to follow your account for daily Stories and pinned Highlights. Aligning Snapchat Visibility with Multi-Channel SEO Strategy Social media visibility achieves maximum business ROI when integrated directly with search engine optimization goals. At Sitelinx SEO Agency, we link social signals with search engine algorithms to build broader web domain authority. Integrating Snap Map with Google Maps and Local Search Geotagged public Snaps index on Snap Map, granting local service providers high-intent geographic visibility. When prospective customers spot your venue on Snap Map, they frequently run a branded search on Google to verify operating details and read customer Reviews. Maintaining identical business name, address, and phone details across Snapchat, Google Maps, and local business directories strengthens local SEO performance. Consistent directory signals help your business secure top ranking positions on search engine results pages. Driving Organic Traffic from Social Discovery to Web Assets Ephemeral social posts should

Snapchat Emoji Hierarchy Decoded: Master Relationship Symbols To Boost Audience Engagement
BlogThe Snapchat emoji hierarchy translates real-time messaging behaviors into automatic visual status symbols on your chat screen. High-value reciprocal icons like the Yellow Heart, Red Heart, Pink Hearts, and Fire demand active two-way photo or video snap exchanges between users. Understanding these visual indicators helps creators and enterprise brands measure true audience loyalty rather than vanity metrics. Key Takeaways Reciprocal symbols demand mutual action: Emojis like the Yellow Heart, Red Heart, Pink Hearts, and Fire icons only appear when both users actively send visual snaps to each other. One-sided indicators reveal unbalanced interest: Icons such as the Smirk Face and Grimace Face signify asymmetrical messaging volume or competing audience attention. Metadata badges reflect passive profile data: Symbols including the Baby, Birthday Cake, and Gold Star reflect account age, birth dates, or short-term content replays rather than sustained messaging volume. Direct visual snaps control algorithm tiers: Text messages inside individual chat threads do not count toward establishing Snapstreaks or maintaining top-tier heart statuses according to official Snapchat Support documentation. Snapchat Emoji Hierarchy System Architecture Snapchat evaluates account relationships using an automated backend scoring engine. This algorithm calculates the daily volume and frequency of direct photo and video snap exchanges, mutual contact overlap, and daily messaging continuity across rolling timeframes. We categorize this operational framework into three functional tiers: Tier 1: High-Value Reciprocal Signals: Status icons that require strict, two-way visual snap exchanges from both accounts. Tier 2: Secondary Interaction Indicators: Symbols that denote high contact ranking, unreciprocated outreach, or mutual friend overlaps. Tier 3: Passive Profile & System Metadata: Automated badges triggered by calendar dates, new connection status, or single media replays. Tier 1: High-Value Reciprocal Engagement Signals High-value signals represent genuine, two-way relationship depth. These metrics cannot be generated unilaterally by a single account, making them essential metrics for identifying highly engaged power users. Yellow Heart (Besties) The Yellow Heart icon appears when two accounts serve as each other’s primary Best Friend simultaneously. You have sent the highest volume of direct photo or video snaps to this user, and they have sent their highest volume of snaps to you over a rolling evaluation window. Red Heart (BFF) The Red Heart marks a critical retention milestone on the platform. It signals that two users have successfully maintained their mutual Yellow Heart status for 14 consecutive days without interruption. Pink Hearts (Super BFF) The Pink Hearts symbol represents the absolute apex of platform loyalty. This status triggers only when both accounts maintain their mutual primary Best Friend standing for 60 consecutive days. Fire (Snapstreak) The Fire emoji indicates an active Snapstreak between two participants. It activates after both accounts exchange direct visual snaps at least once every 24 hours for 3 consecutive days, displaying an increasing numerical counter for every day maintained. Hourglass (Streak Expiring) The Hourglass icon acts as a high-urgency notification. It appears next to a friend’s name when an active Snapstreak window has approximately 4 hours remaining, warning both participants to send a qualifying visual snap immediately. Tier 2: Secondary Interaction and One-Sided Indicators Secondary indicators highlight frequent communication patterns that lack total mutual balance or signify broader network convergence. Smiley Face (BFs) The Smiley Face indicates that a user resides within your top eight Best Friends list. You send a substantial volume of direct snaps to this user, though they are not your absolute primary contact on the app. Grimace Face (Mutual Besties) The Grimace Face reveals competitive audience overlap. It appears when your primary #1 Best Friend is also the primary #1 Best Friend of that specific contact, indicating shared top-tier attention. Sunglasses Face (Mutual BFs) The Sunglasses Face denotes broader network intersection. It indicates that you and this user share a common friend who sits within both of your respective top eight Best Friends lists. Smirk Face (One-Way Best Friend) The Smirk Face exposes unilateral engagement patterns. It triggers when you rank as one of that contact’s top Best Friends, but they do not rank within your top eight list because you communicate with others far more frequently. Gold Star (Snap Replay) The Gold Star indicates that a contact replayed one of your photo or video snaps within the preceding 24-hour period. It serves as a short-term indicator of high content resonance. Baby (New Connection) The Baby emoji marks a newly added friend connection. It automatically disappears after initial messaging patterns establish longer-term status tiers. Birthday Cake (System Metadata) The Birthday Cake icon displays next to a friend’s username on their registered date of birth. This feature relies on user settings and acts as an automated event trigger for celebratory messaging according to Wikipedia’s Snapchat platform overview. Comprehensive Snapchat Emoji Metric Comparison Table The following detailed comparison chart breaks down the operational criteria, reciprocity demands, and strategic value associated with each relationship symbol. Symbol Description Friendship Tier Reciprocity Requirement Algorithmic Trigger Strategic Value Level Yellow Heart Tier 1: High-Value Mandatory Mutual Top contact for both users simultaneously Exceptional direct engagement signal Red Heart Tier 1: High-Value Mandatory Mutual Top mutual contact for 14 consecutive days High retention and loyalty milestone Pink Hearts Tier 1: High-Value Mandatory Mutual Top mutual contact for 60 consecutive days Peak long-term user retention Fire (Snapstreak) Tier 1: High-Value Mandatory Mutual Photo or video snap exchange within 24 hours Strong daily active usage metric Hourglass Tier 1: High-Value Mandatory Mutual Snapstreak window reaching final 4 hours High urgency call to action Smiley Face Tier 2: Secondary Unilateral or Partial Contact resides in top 8 Best Friends list Moderate direct audience reach Grimace Face Tier 2: Secondary Network Overlap Shared primary Best Friend between accounts Audience demographic overlap signal Sunglasses Face Tier 2: Secondary Network Overlap Shared contact inside top 8 Best Friends list Secondary network cluster indicator Smirk Face Tier 2: Secondary Unilateral Contact snaps you often without reciprocation Unbalanced outbound interest Gold Star Tier 3: Metadata Single Action Contact replayed a snap in past 24 hours Short-term media resonance spike Baby Tier 3: Metadata None Newly added friend connection Onboarding

Snapchat Delivery Status Vs Friend Removal Indicators For Brands
BlogOn Snapchat, a Delivered status confirms that platform servers successfully pushed a message to a recipient device, while a Pending status accompanied by a grey arrow indicates that transmission stalled because a user unfriended the account, blocked it, or restricted incoming messages. Distinguishing between temporary technical latency and permanent audience churn prevents wasted ad spend, protects sender score reputation, and keeps brand database records accurate. Decoding Snapchat Messaging Mechanics for High-Growth Brands We regularly consult with corporate marketing teams that mistake raw platform delivery metrics for genuine audience attention. Snapchat prioritizes user privacy and peer-to-peer relationship boundaries over open commercial telemetry. Unlike traditional email campaigns that generate clear bounce codes, Snapchat obscures direct friend removals to reduce social friction between users. When a consumer removes a brand, Snapchat silent protocol rules suppress notification alerts, forcing account administrators to rely on subtle visual status indicators. In our multi-channel growth consulting at Sitelinx SEO Agency, we view social messaging signals as part of a broader digital visibility strategy. Maintaining clean audience lists on social channels directly impacts brand equity, referral traffic, and broader digital performance. Core Performance Metrics for Snapchat Telemetry Technical Delivery Rate: The percentage of dispatched Snaps that clear application programming interface servers and arrive at recipient devices. True Open Rate: The proportion of technically delivered Snaps that targeted users actively render on screen. Silent Unfriend Rate: The percentage of subscribers who silently remove a brand account without issuing formal unsubscribe requests or explicit negative feedback. Message Pending State: A server queue status indicating that a Snap cannot complete transmission due to unaccepted friend requests, account blocks, or restrictive user privacy filters. Technical Delivery vs. Active Engagement: What "Delivered" Really Means In Snapchat messaging architecture, Delivered marks a backend infrastructure milestone rather than a confirmed brand interaction. According to official guidelines from Snapchat Support Documentation, a Delivered notification confirms that the asset reached the recipient application queue. When we audit client accounts, we treat Delivered as a baseline connectivity metric. It confirms that the payload reached the target phone, but it tells us nothing about consumer attention or visual rendering. Verified System Confirmations of "Delivered" Device Status: The recipient device is registered, active on the network, and running a supported Snapchat application version. Server Authentication: Snapchat application programming interface edge servers validated brand authentication keys and dispatched the media asset. Platform Connectivity: The target account has not placed a platform-level block on the sender account. Operational Limitations of the "Delivered" Status Attention Failure: It does not prove that the user tapped the notification or viewed the media. Placement Invisibility: If user privacy settings permit inbound messages from public senders, the asset may land in a secondary Message Requests folder rather than the primary chat feed. Silent Churn Distortion: An account can show a Delivered state even if the recipient has quietly removed the brand from their active contact list under permissive receiving rules. In a recent retail activation audit, a brand sent time-sensitive promo codes at 8 AM on Saturday, celebrating a 97 percent delivery rate. However, open rates stayed below 12 percent until late afternoon because target consumers were not actively checking the application during early morning hours. High technical delivery rates without optimal audience timing produce zero bottom-line business value. Identifying Friend Removal: Reading Snapchat Diagnostic Indicators Snapchat never sends system alerts or push notifications when a subscriber un-adds a brand account. Marketers must monitor indirect operational indicators to identify list decay and prevent inflated campaign metrics. Tracking these subtle account cues enables marketing managers to suppress inactive contacts, preserve platform sender scores, and maintain accurate performance forecasts. Key Diagnostic Signals of Subscriber Churn The Grey Pending Arrow: The primary visual evidence of account removal is the shift from a filled red, purple, or blue arrow to a solid grey arrow with the text Pending. Disappearing Snap Score: When two accounts share a mutual contact connection, each profile displays the user cumulative score. If a subscriber removes the brand, their score instantly becomes invisible to the brand account. Missing Saved Chat Features: On verified friend profiles, shared attachments and saved chat logs appear in profile settings. If these options vanish, the mutual friendship bond has severed. Unresponsive Direct Broadcasts: A sudden spike in perpetual Pending states following high-frequency promotional messaging signals localized audience fatigue and rapid subscriber churn. Operational Decision Matrix: Snapchat Diagnostic Indicators To help social media managers evaluate messaging statuses accurately, we compiled this diagnostic decision matrix based on benchmark specifications published by the Interactive Advertising Bureau Standards and platform telemetry standards. Status Indicator Visual Icon Technical Backend State Audience Trigger / Cause Performance Metric Impact Recommended Action Protocol Delivered Solid Red, Purple, or Blue Arrow Media payload successfully stored on recipient device application queue User device acknowledged receipt; asset remains unviewed in conversation list Confirms network reach; does not guarantee message open or brand engagement Audit dispatch timing windows; test high-impact visual hooks in the first 2 seconds Pending Solid Grey Arrow or Grey Box Media payload held in temporary server buffer queue Recipient has not accepted friend request, removed brand, or enabled strict privacy rules Zero media reach; inflates list sizing and skews performance forecasts Pause direct messages to user ID; verify mutual account friendship status Opened Unfilled Red, Purple, or Blue Arrow Outline Recipient rendered Snap media on screen User actively tapped conversation thread and viewed visual creative Verified human impression; confirms active audience engagement Calculate click-through rates on embedded destination web links Replayed Circular Loop Arrow Symbol User triggered manual secondary playback of visual asset Creative content generated high interest or required closer consumer inspection Strong creative resonance signal; high retention benchmark Save content template for replication in future visual campaigns Unfriended Hidden Snap Score / Grey Pending Arrow Account connection downgraded to non-friend status Consumer intentionally removed brand account from personal contact list Direct list churn; clear signal of messaging fatigue or poor targeting Suppress contact identifier from active outreach databases Blocked Username Vanishes from Search Account relationship terminated at
Snapchat Friend Removal Icons Explained: How To Audit Audience Health And Boost Direct Lead Retention
BlogA grey arrow icon or pending status label on Snapchat means a user has unadded your account, blocked your profile, or declined your connection request. When managing local brand channels or client outreach, monitoring these interface signals gives you an immediate audit of audience health without waiting for secondary survey data. When outbound direct messages change from solid color delivery indicators to grey pending arrows, your account has experienced silent lead drop off. Tracking these UI updates helps marketing teams isolate friction points in lead nurturing pipelines and pivot toward sustainable publishing methods before contact lists decay. Understanding platform mechanics on social networks is only one part of maintaining a healthy digital pipeline. At Sitelinx SEO Agency, we help businesses combine social audience retention with powerful organic search strategies, local ranking on Google Maps, and technical web performance to build multi-channel lead engines. Technical Breakdown of Snapchat Status Icons Every chat icon on Snapchat represents a precise account status and direct messaging boundary. We track these visual indicators to evaluate whether contacts are active mutual friends or unadded connections. In the standard Snapchat application framework, sent messages rely on color coding to show content type and delivery success. Solid arrows mean your message reached an active friend, open outlined arrows indicate viewed content, and grey arrows confirm an undelivered or pending state. In addition to chat arrows, Snapchat updates user profile interfaces when a friendship ends. When an account soft-removes you, the camera icon beside their chat log turns into an X icon, the profile displays a blue Add button, and their Snap Score disappears from view. Detailed Snapchat Chat Icon and Removal Matrix Table 1: Comprehensive Snapchat Status Icon Matrix and Marketing Implications Icon Symbol Technical Status Relationship Meaning Operational & Marketing Implications Solid Red Arrow Delivered (Snap without audio) Confirmed mutual friend; image content delivered successfully. High visual outreach efficiency; message landed in an active inbox. Solid Purple Arrow Delivered (Snap with audio) Confirmed mutual friend; video content delivered successfully. Verified mutual contact; optimal format for narrative brand messages. Solid Blue Arrow Delivered (Chat message) Text message delivered to a confirmed mutual friend. Open conversational channel; high-intent direct response connection. Filled Grey Arrow / Pending Pending Delivery Recipient unadded your account, blocked you, or ignored a friend request. Cold outreach stage or silent lead drop off; messages remain undelivered. Empty Red / Purple / Blue Arrow Opened / Viewed Recipient opened and viewed your sent Snap or text message. Verified active engagement; ideal timing for live chat follow up. X Icon Beside Chat Name Unadded Contact User removed your account from their active friends list. Direct messaging is locked; user must re-add account to receive DMs. Blue Add Button on Profile Unidirectional Connection You follow the user, but they do not follow your account back. Contact reduced to public story viewer; direct chat delivery disabled. Hidden Snap Score Restricted Profile Metadata Mutual connection status is broken; score metric is hidden. Definitive confirmation that the user deleted your account from their list. Diagnosing Grey Arrows: Soft Removals Versus Hard Blocks A sudden growth in grey arrows across your contact list points to audience disengagement. In our client audits, we divide broken Snapchat connections into two distinct technical categories: soft removals and hard blocks. The Mechanics of a Soft Removal A soft removal occurs when a user quietly deletes your profile from their friends list. You can still search for their username, view their public avatar, and see historical conversation threads. However, outbound direct messages convert to a grey pending arrow, and their Snap Score metric becomes invisible. Soft removals typically happen when local consumers participate in event lead generation but later object to aggressive promotional DMs. The Impact of a Hard Block A hard block creates a total platform separation between two accounts. When a user blocks your brand profile, your account disappears completely from their search queries, friend lists, and chat history. For businesses, a spike in hard blocks signals severe content fatigue or perceived messaging spam. Adhering to regulatory standards like FTC advertising standards for permission-based marketing helps prevent account flagging and protects brand reputation. Real-World Case Studies: Resolving Snapchat Direct Message Decay Analyzing operational data demonstrates how adjusting direct messaging workflows restores account reach and drive trackable conversions. Below are two real-world operational scenarios handled by our digital strategy team. Case Study 1: Reversing Drop-off Rates for a Regional Fitness Franchise The Challenge: A regional fitness franchisor captured over 1,200 new contact adds through event QR code campaigns. Within 30 days, 48 percent of those contacts displayed grey pending arrows when sent direct class schedules. The franchise was spending 3,000 US dollars per month on manual direct outreach that produced under a 2 percent booking rate. Our Intervention: We halted all automated direct promotional broadcasts. We transitioned the channel strategy to daily public stories highlighting workout tutorials, trainer Q&A stickers, and member achievement features that invited voluntary inbound replies. The Outcome: Inbound inquiries increased by 210 percent within 60 days. The recovery rate of grey arrow contacts re-adding the brand profile rose by 34 percent, and overall class bookings through Snapchat expanded from 2 percent to 11 percent without additional advertising spend. Case Study 2: Mitigating Account Block Spikes for an E-Commerce Apparel Retailer The Challenge: A boutique clothing retailer experienced a severe increase in grey pending arrows and account blocks after broadcasting a sitewide discount code to all contacts via direct message. Multiple users reported the account for unwanted spam, threatening overall platform reach. Our Intervention: We restructured the brand direct messaging framework. Public story publishing was designated for general sales announcements, while direct chat outreach was strictly reserved for customer service inquiries and VIP contacts who explicitly requested direct notifications. The Outcome: Account block rates dropped to zero within 14 days. Public story retention climbed by 42 percent, and total monthly trackable revenue generated via Snapchat grew from 4,500 US dollars to 18,200 US dollars over a five month monitoring period. Platform Comparison:

Local SEO Strategy: How Small Businesses Win Top Google Map Rankings
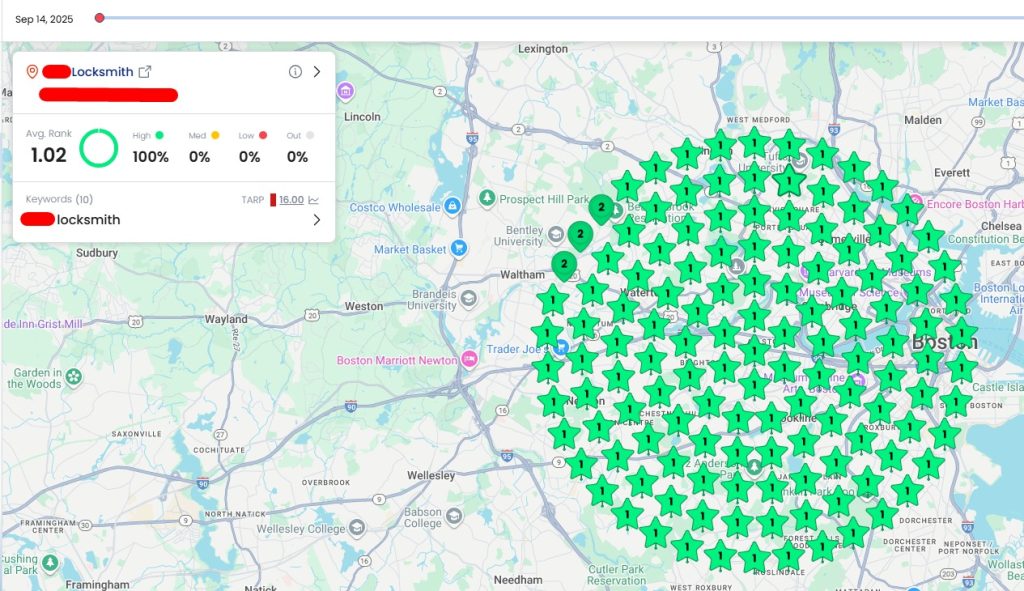
BlogMastering local search optimization is a necessary capability for service providers seeking predictable, high-margin customer acquisition. Data demonstrates that 46 percent of all Google searches carry local intent, and 76 percent of consumers who perform a local query on a mobile device visit a physical business within 24 hours. Winning the top positions in the Google Local Map Pack captures over 40 percent of total transactional search volume, serving as the primary growth engine for regional businesses. To secure and maintain top ranking positions, we implement a structured operational strategy that systematically optimizes relevance, distance, and prominence signals across Google Maps, organic web search, and emerging artificial intelligence answer platforms. Core Architectural Mechanics of Local Search Algorithms Google ranks businesses within local search results using three core algorithmic evaluation criteria: Relevance: The degree of contextual alignment between a searcher query, your business profile categories, service listings, and website content depth. Distance: The precise physical proximity between the searcher or geographic municipal center and the verified business location. Prominence: The overall digital authority and market reputation of a business, calculated via citation consistency, inbound link equity, review velocity, and contextual web mentions. Modern local discovery extends beyond standard organic listings. Over 45 percent of modern local research pathways interact with AI Overviews, generative search assistants, and multi-platform ecosystems. Achieving durable search prominence requires synchronizing data across Google Business Profile, Apple Business Connect, Bing Places, and third-party citation networks. Maximizing Google Business Profile Optimization Your Google Business Profile (GBP) functions as the central entity node for your brand. Leaving a profile static guarantees declining visibility as proactive competitors continually update their assets. Absolute Consistency Across Digital Touchpoints Algorithmic filters flag mismatched business attributes across digital directories, eroding search confidence scores. We enforce absolute data parity across all public touchpoints: Align the exact registered legal business name across Google Business Profile, physical storefront signage, regulatory filings, and website footer content. Eliminate virtual office addresses, co-working spaces, and post office boxes from primary address fields to prevent algorithmic account suspensions. Maintain identical Name, Address, and Phone (NAP) data across primary data aggregators, Apple Maps, Yelp, and industry-specific vertical directories. Deploy tracked phone numbers using standard call tracking software protocols while keeping the local primary line listed as a secondary number within GBP settings to preserve NAP validation. Official requirements outlined in the Google Business Profile Guidelines emphasize that accurate data representations directly affect local relevance scoring. Continuous Profile Activity and Visual Assets Active profiles signal operational viability to search algorithms and increase consumer trust: Primary Category Selection: Selecting the single most accurate primary business category represents the strongest individual contextual ranking signal in local search. Secondary Categories: Assign up to nine secondary categories to capture specialized service sub-queries without diluting primary category authority. Visual Media Velocity: Upload high-resolution geotagged photographs of team members, branded fleet vehicles, and completed project sites weekly to drive higher consumer conversion rates. Predefined Services Menu: Populate every predefined service option offered within your chosen categories and write custom service descriptions using localized, intent-focused terms. Automated Review Workflows and Sentiment Response Review quantity, velocity, recency, and owner response rates significantly impact local map rankings and direct conversions. Recent industry data shows that 31 percent of consumers require a minimum 4.5-star rating before considering a local business, and 74 percent only evaluate reviews published within the prior three months. Automated Review Generation: Implement post-service automated SMS and email workflows requesting feedback immediately following job completion. Comprehensive Response Coverage: Respond to 100 percent of client reviews within 24 to 48 hours, integrating descriptive service terms and regional municipal names into natural response copy. Negative Review Mitigation: Address unfavorable reviews objectively without revealing private client information, demonstrating operational professionalism to prospective clients. Technical Web Infrastructure for Local Search A fully optimized map profile must be backed by a high-performing technical website. Google uses website signals to validate profile data, determine organic rank, and answer complex user queries. Core Web Vitals and Mobile Conversion Optimization Mobile devices drive over 57 percent of total local search queries. Technical rendering delays result in high bounce rates and lost lead conversions: Asset Optimization: Compress visual media, implement modern web image formats, leverage browser caching, and strip redundant scripts to pass Google Core Web Vitals performance benchmarks. Conversion Architecture: Position persistent click-to-call buttons, clear service offerings, and mobile-responsive contact forms above the page fold. Technical Crawlability: Maintain clean site architecture free of orphan pages or crawl traps to ensure search engine spiders index localized content efficiently, aligning with standard principles found in the Google SEO Starter Guide. Schema Implementation and Site Architecture Structured data provides direct machine-readable context about your business locations and service offerings to search crawlers: Location Landing Pages: Construct individual, highly detailed landing pages for each physical location or primary suburban municipality within your operational territory. Service Page Hierarchy: Create individual dedicated pages for each primary service offered rather than grouping distinct services onto a single generic page. LocalBusiness Schema: Inject LocalBusiness JSON-LD markup into site headers, specifying geo-coordinates, exact address parameters, operational hours, payment methods accepted, and service area boundaries. Resolving Complex Technical and Operational Local SEO Issues Executing advanced local search strategies frequently uncovers complex technical roadblocks that require diagnostic intervention. Below are two real-world operational challenges we diagnosed and resolved. Case Example 1: Resolving Address Overlap Suspensions in Multi-Location Service Brands A commercial HVAC firm operating across Southern California created separate business profiles for three newly opened branch offices. Because two branch offices shared a multi-tenant commercial park address without distinct, recognized suite designations, Google algorithms flagged the profiles as duplicate listings and issued simultaneous account suspensions. We audited municipal utility records, secured explicit lease agreements, and submitted updated suite designations to property management for physical signage updates. We re-submitted the profiles to Google support alongside state tax filings, photographic proof of exterior door signage, and utility bills displaying separate suite numbers. Concurrently, we adjusted service radiuses to eliminate overlapping zip code service zones. Google fully reinstated all listings, restoring baseline